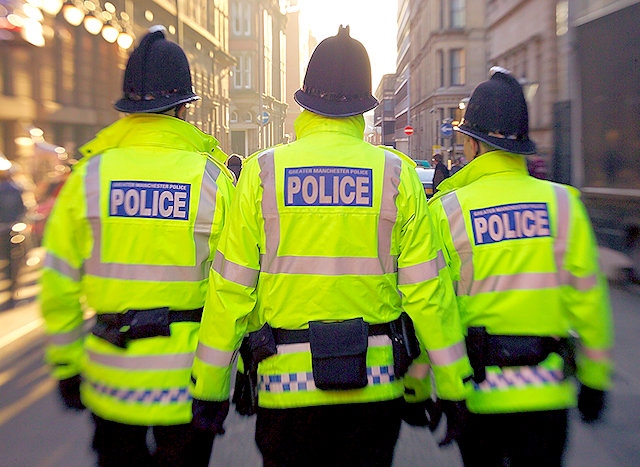
Recorded crime in the last year rose by nine percent, but how does the Rochdale borough fit into the national picture?
Date published: 21 February 2019

Total crime in the Rochdale borough accounted for less than eight percent of all crime recorded in Greater Manchester
Recorded crime in the Rochdale borough rose by nine percent in the 12 months between September 2017 and September 2018, the latest figures from the Office for National Statistics show.
One in eight residents of the borough was a victim of crime in the 12 months to last September, compared to one in nine the previous year.
However, whilst more than half of all crimes reported in the north west happened in Greater Manchester – 14% of all crimes in England, excluding fraud – total crime in the Rochdale borough accounted for less than eight percent of all crime recorded in Greater Manchester (7.9%) – and less than one percent of incidents recorded across 295 local authorities in England (0.6%).
Rochdale Online has broken down how each type of recorded crime differed between September 2017 and September 2018, and how our borough fares on a national level.
Bicycle thefts
- Local authority with highest percentage of incidents – Cambridge
- Rochdale's position – joint 174th (of 295 local authorities)
- 12.5% decrease from 2017
Criminal damage and arson
- Local authority with highest percentage of incidents – Leeds
- Rochdale's position – joint 37th (of 295 local authorities)
- 7.9% decrease from 2017
Death or serious injury caused by illegal driving
- Local authority with highest percentage of incidents – North Yorkshire
- Rochdale's position – joint 68th (of 206 local authorities which provided data)
- No change from 2017
Drug offences
- Local authority with highest percentage of incidents – Liverpool
- Rochdale's position – joint 121st (of 295 local authorities)
- 6.1% increase from 2017
Homicide
- Local authority with highest percentage of incidents – Manchester
- Rochdale's position – joint 23rd (of 216 local authorities which provided data)
- 33.3% decrease from 2017
Miscellaneous crimes against society
- Local authority with highest percentage of incidents - Leeds
- Rochdale's position – joint 18th (of 294 local authorities which provided data)
- 36.5% increase from 2017
Non-residential burglary
- Local authority with highest percentage of incidents - Birmingham
- Rochdale's position – joint 57th (of 295 local authorities)
- 71.1% increase from 2017
Other thefts
- Local authority with highest percentage of incidents – Westminster
- Rochdale's position – joint 61st (of 295 local authorities)
- 2.9% increase from 2017
Possession of weapons offences
- Local authority with highest percentage of incidents - Birmingham
- Rochdale's position – joint 38th (of 294 local authorities which provided data)
- 45.8% increase from 2017
Public order offences
- Local authority with highest percentage of incidents - Manchester
- Rochdale's position – 21st (of 294 local authorities which provided data)
- 8.5% increase from 2017
Residential burglary
- Local authority with highest percentage of incidents - Birmingham
- Rochdale's position – 49th (of 294 local authorities which provided data)
- 71% increase from 2017
Robbery
- Local authority with highest percentage of incidents – Birmingham
- Rochdale's position – 56th (of 294 local authorities which provided data)
- 10.6% increase from 2017
Sexual offences
- Local authority with highest percentage of incidents - Birmingham
- Rochdale's position – 42nd (of 295 local authorities)
- 4.2% increase from 2017
Shoplifting
- Local authority with highest percentage of incidents – Birmingham
- Rochdale's position – joint 108th (of 295 local authorities)
- 5.3% increase from 2017
Stalking and harassment
- Local authority with highest percentage of incidents - Leeds
- Rochdale's position – 41st (of 295 local authorities)
- 10.3% increase from 2017
Theft from the person
- Local authority with highest percentage of incidents – Westminster
- Rochdale's position – joint 99th (of 294 local authorities which provided data)
- 5.7% decrease from 2017
Vehicle offences
- Local authority with highest percentage of incidents - Birmingham
- Rochdale's position – joint 49th (of 295 local authorities)
- 11.7% increase from 2017
Violence with injury
- Local authority with highest percentage of incidents - Birmingham
- Rochdale's position – joint 64th (of 295 local authorities)
- 1.5% increase from 2017
Violence without injury
- Local authority with highest percentage of incidents - Leeds
- Rochdale's position – joint 32nd (of 295 local authorities)
- 7.4% increase from 2017
Do you have a story for us?
Let us know by emailing news@rochdaleonline.co.uk
All contact will be treated in confidence.
Most Viewed News Stories
- 1Royton haulage firm fined after Rochdale dad went to work and didn’t come home
- 2Six men arrested in Rochdale child exploitation investigation
- 3Suspended council candidate was ‘politically naive’ for appearing in George Galloway video, leader...
- 4Rochdale church to host Camerados public living room
- 530 years of the GEM Appeal, a Rochdale-founded charity that has raised millions and changed the...
To contact the Rochdale Online news desk, email news@rochdaleonline.co.uk or visit our news submission page.
To get the latest news on your desktop or mobile, follow Rochdale Online on Twitter and Facebook.


